Pedestrian Danger Zones: West Coast Cities Where Walking Is Weirdly Risky

When does a crosswalk feel like a dare? On wide, fast arterials with long gaps between safe crossings, poor nighttime lighting, and driveways every 30 feet. Stack in speed, alcohol, and distraction, and you get cities where walking is riskier than it should be—especially for seniors, night workers, and anyone near a bus stop on a high-speed road. Below: West Coast metros that repeatedly surface high on per-capita pedestrian deaths when you control for how many people walk—and the corridors locals say feel like a contact sport.
Table of Contents
Los Angeles, CA
Why it’s risky: Superblocks, 35–45 mph arterials, and long nighttime exposure. The worst isn’t the downtown grid—it’s the high-speed spokes that carry most traffic.
Corridor callouts: Venice Blvd, Sepulveda, Vermont Ave, Whittier Blvd, Sherman Way, and valley arterials with six lanes, minimal refuge islands, and long signal cycles. Nighttime and weekend peaks tell the story.
Local push: Median refuges, shorter signal phases, speed cameras (where allowed), raised crosswalks at bus stops, and left-turn calming on multi-lane corridors. The quick win: light the crosswalks and cut approach speeds—half the risk disappears with 5–10 mph less.
📍 GET THE ULTIMATE PNW MAP 🗺️
Get our curated list of the best adventures, things to do, and places to grab a brew loaded onto your maps with just two clicks!
✅ Waterfalls ✅ Hikes ✅ Viewpoints
✅ Craft breweries ✅ National Parks ✅ 1400+ Pins


San Diego, CA
Why it’s risky: Long suburban arterials meet dense pedestrian pockets near transit and beaches.
Corridor callouts: El Cajon Blvd, University Ave, Market St, El Camino Real, and the Pacific Highway strip. Midblock dashes to bus stops and nighttime crossing near bars show up repeatedly in reports.
Local push: High-visibility crosswalks every 1/8 mile on commercial stretches, leading pedestrian intervals, and no-right-on-red near nightlife. Curb-level bus bulbs keep people out of traffic while boarding.
San Jose, CA (South Bay)
Why it’s risky: Tech-campus commutes overlay fast expressways that look like freeways but intersect neighborhoods.
Corridor callouts: Almaden Expwy, Capitol Expwy, Monterey Rd, Stevens Creek Blvd, plus Story Rd near retail clusters. Seniors and night-shift workers are over-represented.
Local push: Light, shorten, and multiply crossings; add refuge islands and tighten turning radii at gas-station corners where fast right turns clip the crosswalk.
Oakland, CA
Why it’s risky: A classic high-injury network: fast arterials threading dense neighborhoods with lots of bus riders.
Corridor callouts: International Blvd (E 14th), San Pablo Ave, Foothill Blvd, MacArthur Blvd. Night/weekend spikes, plus “multiple threat” crashes on multi-lane roads (one lane stops, the next doesn’t).
Local push: Bus-only lanes with hardened medians (fewer passing lanes to hide pedestrians), daylighted corners, and automatic speed enforcement on the worst segments.

San Francisco, CA
Why it’s risky (even with lots of walkers): Fewer miles of high-speed road, but a stubborn cluster of hot corridors where turning traffic and wide one-ways clash with foot traffic.
Corridor callouts: Geary Blvd, 19th Ave, Sloat Blvd, 6th St → SoMa grid, Van Ness/Market area. Seniors and dusk/dark trips dominate.
Local push: Side-running transit lanes with islands, protected left-turn phases, and raised intersections on one-way “speedways.” Lighting + 25 mph enforcement where people actually cross, not where models think they do.
Sacramento, CA
Why it’s risky: Suburban arterials with 40 mph targets, long gaps between signals, and heat-island nighttime walking.
Corridor callouts: Stockton Blvd, Florin Rd, Watt Ave, Arden Way, and the Fulton corridor near retail strips. Bus-stop midblock crossings are a pattern.
Local push: Put crossings at bus stops (not 600 feet away), add beacons every 600–800 feet on shop streets, and slow left turns with hardened centerlines.
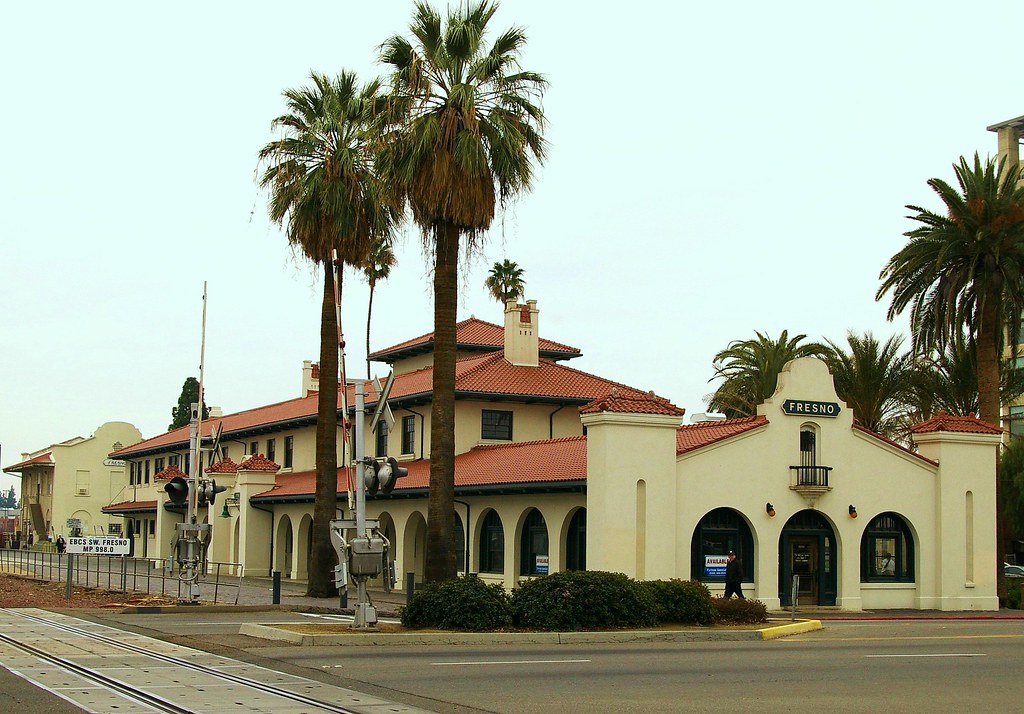
Fresno, CA
Why it’s risky: Ultra-wide arterials, long blocks, and major retail on stroad segments where people cross because that’s where the destinations are.
Corridor callouts: Blackstone Ave, Kings Canyon/Ventura, Shaw Ave, Cedar Ave. Nighttime collisions dominate; dusk glare in summer is a killer.
Local push: Continuous lighting, pedestrian refuge islands every block or two, and speed management near big-box driveways. Shade trees help visibility by cutting sunset glare.
Bakersfield, CA
Why it’s risky: High speeds, long sight lines, and lots of nighttime essential trips.
Corridor callouts: Ming Ave, White Ln, Panama Ln, N Chester Ave, and Rosedale Hwy near commercial clusters. Multi-lane “multiple threat” crashes are common.
Local push: Median breaks with beacons at desire lines, lower posted speeds where driveways are dense, and quick-build separators to prevent lane-weaving through stopped traffic.
Portland, OR
Why it’s risky: A tale of two cities—walkable inner grid vs. fast outer arterials east of 82nd Ave with fewer crossings and poor lighting.
Corridor callouts: SE Division St (especially 82nd → 174th), 122nd Ave, outer Powell Blvd, Marine Dr. Speed + distance to the next marked crosswalk = bad math.
Local push: Raised crosswalks every quarter-mile, median islands with beacons, protected intersections, and continuous lighting on the outer grid.
Seattle, WA
Why it’s risky: Hilly sightlines and a few state-route arterials cutting through neighborhoods.
Corridor callouts: Aurora Ave N (SR-99), Rainier Ave S, MLK Jr Way S, and 15th Ave NW near freight/retail. Night and dawn crashes are over-represented.
Local push: Center-running transit islands (fewer through lanes), automated speed enforcement, and signal timing that shortens crossing distances with split-phased turns.
Spokane, WA
Why it’s risky: Arterials that carry freeway behavior into city blocks, with long winter nights and glare off snow.
Corridor callouts: Division St (US-2/395), Sprague Ave, Market St. Bus-stop midblock crossings and turning drivers at strip-mall driveways are repeat themes.
Local push: Bus-islands with Z-crossings, curb extensions that reduce exposure time, and “no right on red” near transit stops.

Honolulu, HI (Pacific bookend)
Why it’s risky (and why it belongs in the conversation): Not mainland, but West Coast travelers’ orbit—and per-capita risk stays high given lots of older pedestrians and multi-lane arterials.
Corridor callouts: Kapiolani Blvd, Nimitz Hwy, King St, and portions of Farrington Hwy. Dusk/dark with rain is the danger cocktail.
Local push: Leading pedestrian intervals citywide, illuminated backplates on signals, and raised crossings near bus stops and schools.
The Fixes That Move the Needle (Clip This)
- Speed first. A 5–10 mph drop slashes death risk; design for 25–30 mph where people cross.
- Crossing density. Put marked, lit crossings every 600–800 feet on commercial arterials—especially at bus stops.
- Refuge islands. Two-stage crossings cut exposure time in half on multi-lane roads.
- Turn calming. Protected left-turn phases and hardened centerlines reduce “looked but didn’t see” crashes.
- Night visibility. Continuous lighting, reflective backplates, and high-contrast crosswalks save lives where most deaths occur—after dark.
Method note: Rankings emphasize multi-year fatality rates per 100k residents and per walking commute share, plus corridor clustering from state databases. Individual years wobble with enforcement and projects, but the corridors above surface again and again.