West Coast “Power Outage Capitals”: Towns That Go Dark the Most

Who really lives by flashlight on the West Coast? Meet the places where geography, trees, wind, fire weather, and aging lines combine to flip the lights more than locals would like. Our Grid Pain Index (GPI) blends three signals:
— SAIDI/SAIFI from utility reliability reports (how long/how often customers lose power)
— PSPS (Public Safety Power Shutoffs) frequency where utilities cut power during extreme fire weather
— Event mix (winter wind/ice, landslides, king-tide salt spray, equipment) adjusted by population so tiny hamlets don’t skew the list
GPI shifts year to year; think of this as a 3-year rolling reality check. Prep tip at the end—clip it.
Table of Contents
- Grass Valley & Nevada City, CA (Sierra Foothills)
- Calistoga & Angwin, CA (Upper Napa County)
- Occidental–Bodega–Jenner, CA (Sonoma Coast & Ridges)
- Clearlake & Cobb, CA (Lake County Highlands)
- Lincoln City–Depoe Bay, OR (Central Oregon Coast)
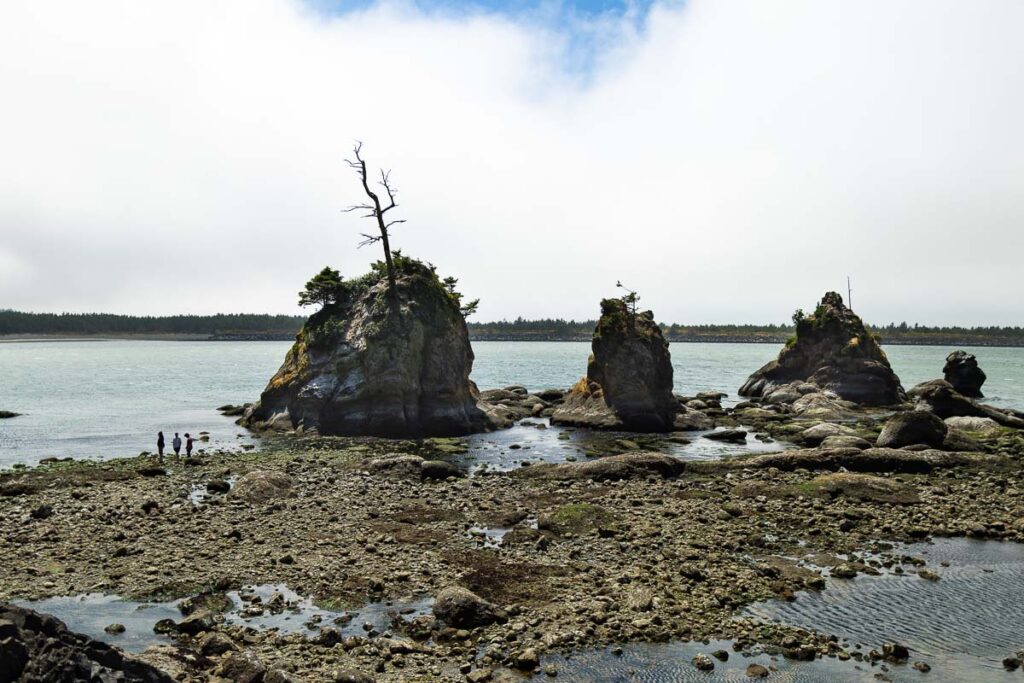
- Tillamook & Nehalem Bay, OR
- Aberdeen–Hoquiam, WA (Grays Harbor)
- San Juan Island (Friday Harbor), WA
- Ramona & Alpine, CA (San Diego County Backcountry)
- Medford–Ashland Foothills, OR
- Port Angeles & Forks, WA (Olympic Fringe)
Grass Valley & Nevada City, CA (Sierra Foothills)
Why it ranks: Tall, dry fuels meet steep canyons and single-circuit lines. This corridor sees PSPS in red-flag wind plus good old-fashioned winter storm treefalls.
When it’s worst: Oct–Nov (fire weather) and Dec–Feb (heavy, wet snow).
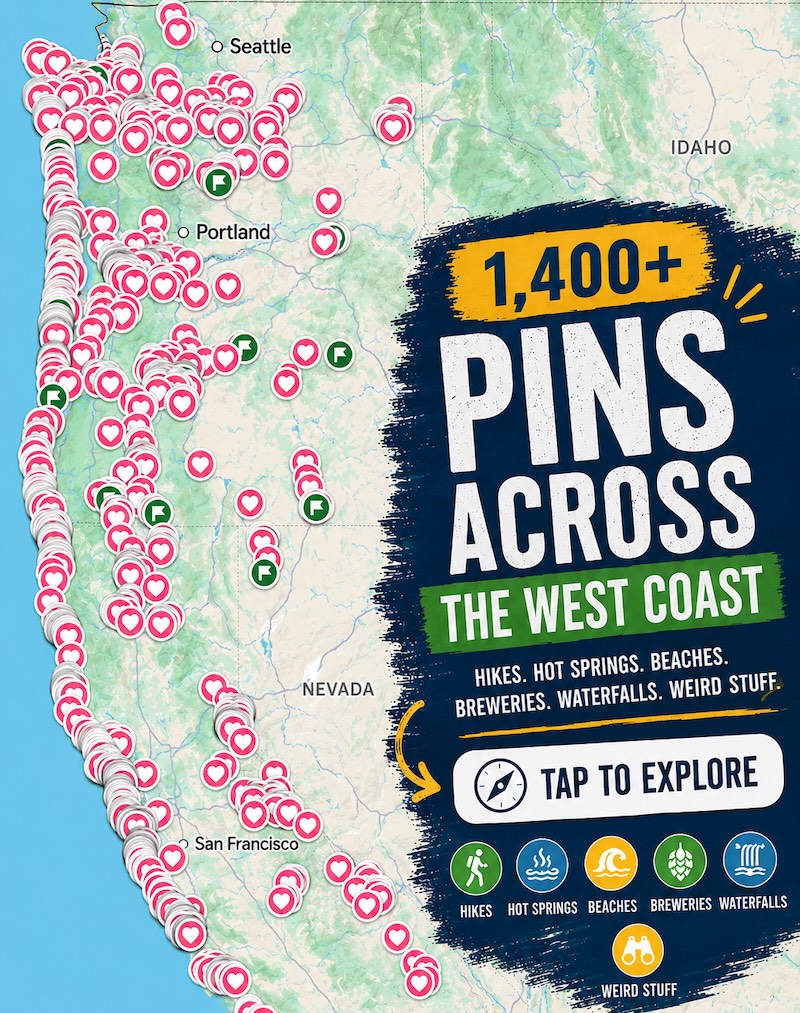
📍 GET THE ULTIMATE PNW MAP 🗺️
Get our curated list of the best adventures, things to do, and places to grab a brew loaded onto your maps with just two clicks!
✅ Waterfalls ✅ Hikes ✅ Viewpoints
✅ Craft breweries ✅ National Parks ✅ 1400+ Pins


Local reality: Generators hum, fridges are on smart strips, and folks know their neighborhood “last to restore” pockets. Text alerts are a lifestyle, not an app setting.
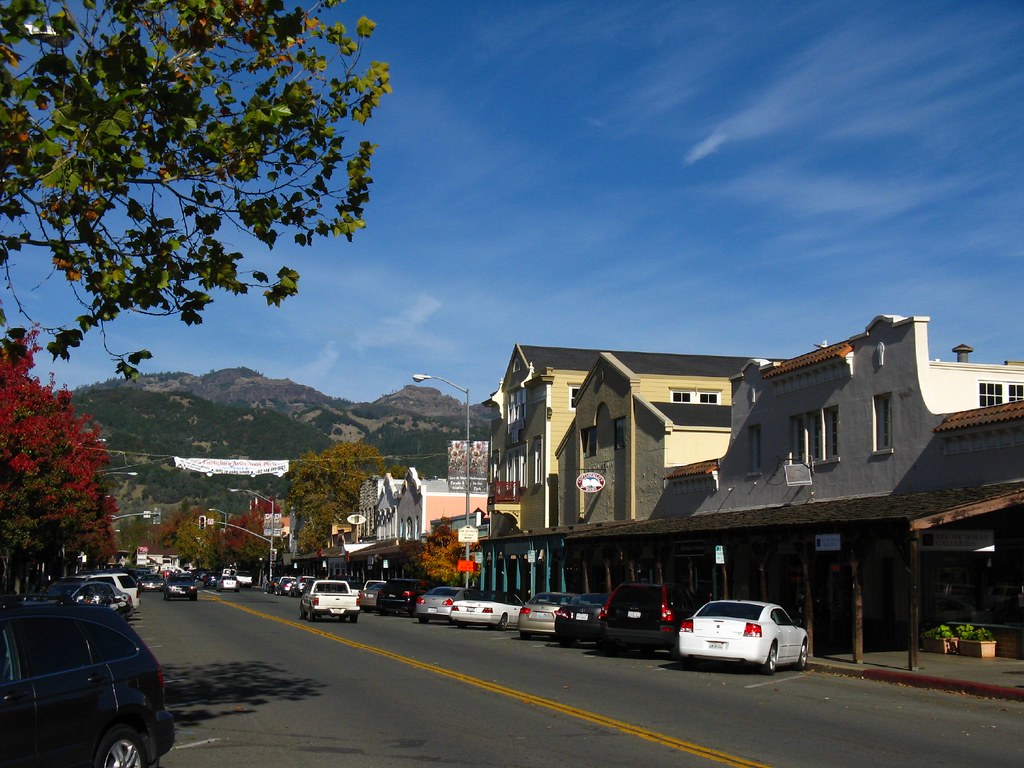
Calistoga & Angwin, CA (Upper Napa County)
Why it ranks: Narrow ridges, windy gaps, and a high PSPS risk profile. Even on blue-sky days, Diablo winds can send lines offline preemptively. Winter brings mud/trees across roads that delay repair crews.
When it’s worst: Early fall wind events; secondary spike in mid-winter storms.
Local reality: Battery back-ups for wells, portable power for fridges, and cafés that turn into community charging stations the minute the gusts start.
Occidental–Bodega–Jenner, CA (Sonoma Coast & Ridges)
Why it ranks: Ocean salt spray + redwood forest + twisting roads. Crosswinds and treefall chew at coastal feeders; PSPS also shows up on hot, off-shore wind days.
When it’s worst: Nov–Feb coastal storms; Sept–Oct off-shore wind.
Local reality: People shop by headlamp and know exactly which hilltop has one bar of service during an outage.
Clearlake & Cobb, CA (Lake County Highlands)
Why it ranks: Fire-weather exposure plus winter wind and snow at elevation. Lines run through heavy fuels; shutoffs happen preventatively, and storms finish the job.
When it’s worst: Late summer–fall for PSPS; January for treefall/ice at higher neighborhoods.
Local reality: Extra water jugs and chest freezers on backup are standard gear; neighbors text each other transformer pops like weather reports.
Lincoln City–Depoe Bay, OR (Central Oregon Coast)
Why it ranks: Piney, salt-sprayed coast with routine gale cycles. Trees + saturated soils = predictable line hits; landslides can isolate pockets and slow trucks.
When it’s worst: Nov–March.
Local reality: People plan errands between wind advisories, and know which bluff-top streets keep lights when lower feeders trip.
Tillamook & Nehalem Bay, OR
Why it ranks: Bays, dairy flats, and forested headlands act like a wind tunnel. Salt, storm surge, and old-growth limbs don’t do conductors any favors.
When it’s worst: December king tides + wind events.
Local reality: Propane is love, and everyone has a mental “extension cord map” for neighbors with medical gear.
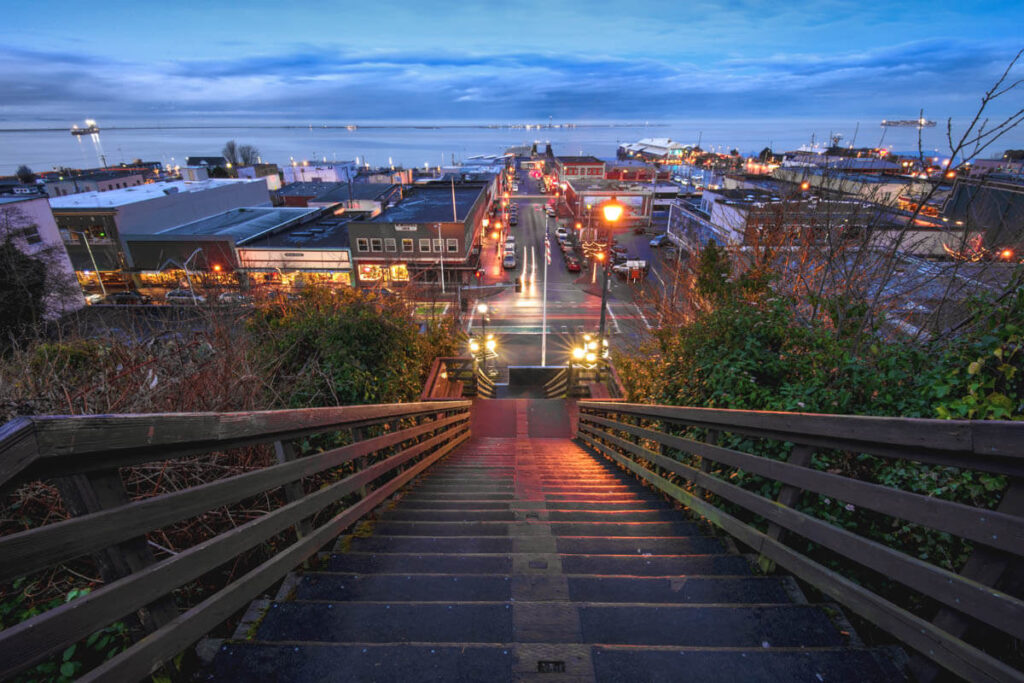
Aberdeen–Hoquiam, WA (Grays Harbor)
Why it ranks: Pacific storms slam the Chehalis and harbor; saturated ground + tall conifers = downed lines. River flooding adds detours for crews.
When it’s worst: Nov–Feb, with occasional spring blows.
Local reality: Mariners watch bar conditions; everyone else watches the tree line and stacks batteries the week before Thanksgiving.
San Juan Island (Friday Harbor), WA
Why it ranks: Island grids = long radial feeders, submarine cables, and lots of trees. One well-aimed limb or a ferry-delay for a part can extend restore times.
When it’s worst: Winter wind; occasional summer blips during tourist load peaks.
Local reality: Propane fridges/cooktops, ham radios, and neighborhood text chains that run better than most apps.
Ramona & Alpine, CA (San Diego County Backcountry)
Why it ranks: Chaparral slopes and Santa Ana wind exposure make PSPS common. Summer lightning and winter rains each create their own outage flavor.
When it’s worst: Sept–Nov Santa Ana season; Jan storms.
Local reality: Portable power stations and well pumps on transfer switches; folks time grocery runs around forecasted shutoff windows.
Medford–Ashland Foothills, OR
Why it ranks: Rogue Valley winds, canyon lines, and recent fire history drive proactive shutoffs and storm-blown outages. Post-fire debris and reburn risk keep utilities cautious.
When it’s worst: Late summer–fall for PSPS; Dec–Feb wind/ice.
Local reality: Solar + battery combos are quietly common; coffee shops double as device triage centers after a blow.
Port Angeles & Forks, WA (Olympic Fringe)
Why it ranks: The peninsula catches edge-of-the-Pacific wind, heavy rain, and occasional timberfall across remote spans. Road closures can box crews out.
When it’s worst: Deep winter.
Local reality: Generators and wood heat are old news; locals top off fuel and water when the pressure drops and the trees start talking.
The Quick “Grid Pain” Prep List (Clip This)
- Power pyramid: fridge first (cold packs + temperature monitor), phone/hotspot, lights (USB headlamps), then comfort (fan/heater on safe backup).
- Water math: 1–2 gallons per person/day + a few toilet tank refills.
- Cook without plug-ins: camp stove + carbon-monoxide-safe rules; no indoor grills.
- Info flow: sign up for utility texts + your county alert system; keep a tiny AM/FM or weather radio.
- Cords & transfer: if you run a generator, use a transfer switch—no backfeeding.
- Neighborhood win: trade cell numbers with two neighbors now; during a blackout, you’ll share ice, news, and spare outlets.
(Note: specific rankings wobble with each storm year and utility upgrade cycle. The towns above rise to the top when you blend SAIDI/SAIFI, PSPS frequency, and event mix over a recent 2–3 year window.)